Development managers are inundated by metrics – from code coverage to lead time, velocity, MTTR, and customer satisfaction. But these metrics are not enough to really understand what is happening “under the hood.”
What are Software Development Managers Missing?
Development managers know what is being produced and at what pace. What is less clear is the quality of the software, how likely it is to satisfy customer requirements, and what are the risks of quality issues that will hurt customer satisfaction.
The lack of real software quality metrics results in:
- Limited visibility over large-scale development efforts
- Limited ability to define goals and ensure they are met
- Limited control over the return on large R&D investments
Conversely, adding real software quality metrics can improve the ability to evaluate teams, guide them in improving their performance and drive more ROI from software development initiatives.
Source: Cigniti
The Missing Software Testing Metrics: Investment in Testing and Readiness to Ship
We suggest two new code quality metrics that can change the game and provide real visibility into “what’s inside” the code that the software dev teams are producing.
Investment in Testing Metric
This metric shows how much the organization is investing in testing, compared to the actual level of quality risk in an application. The metric looks at two sets of data:
- Which parts of an application are at higher risk of quality issues because they have new functionality, code changes, or because they are used frequently in production.
- Holistic test coverage—Which parts of an application are tested across all testing levels; not just unit tests but also UI tests, integration tests, end-to-end tests, etc.
This metric, when applied to a software portfolio, can divide projects into four quadrants:
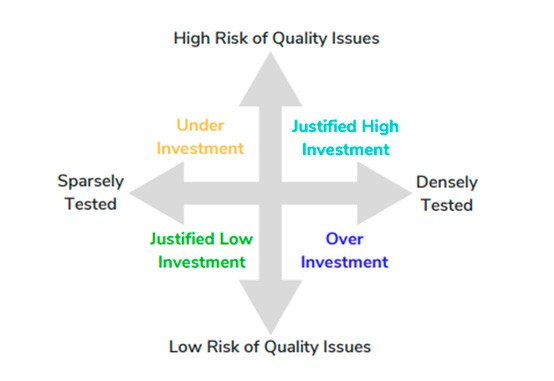
Development managers can take different actions in each quadrant:
| Quadrant | The Situation | Management Action |
| Under Investment | Software that is high at risk of production issues and doesn’t have enough tests | Invest more in quality to reduce the risk |
| Justified Low Investment | Software at low risk of production issues (e.g. legacy software) with low test coverage | Do not invest more in quality, focus on maintenance |
| Justified High Investment | Software at high risk of production which has good test coverage across all test levels | Provide enough resources to maintain the current high level of quality |
| Over Investment | Software at low risk of production issues but with an unnecessarily high level of test coverage | Retire some test infrastructure, divert resources to other applications |
Readiness to Ship Metric
This metric measures the likelihood of different software versions to break in production. It looks at the same data as the Investment in Testing metric – which parts of an application are at higher risk, and the holistic test coverage.
However, here the focus is on evaluating software versions released by a development team. The metric can assign two numeric values to each release:
- Number of test gaps—Important and untested features
- Holistic test coverage percentage—How comprehensively the release is tested as a whole
The lower the number of test gaps and the higher the test coverage percentage, the more a release is ready to ship.
Using these two metrics, development managers can get a good idea of “how good” is the code developed and shipped by development teams, and what action is needed to reduce risk and improve customer satisfaction.
Quality Intelligence: Delivering Next-Generation Software Quality Metrics
In this blog, we communicated the power and value of having metrics like Investment in Testing and Production Readiness at your disposal, however we didn’t address where the data comes from or how exactly to compute the metrics.
In reality, these metrics are not available to the vast majority of development organizations, for two reasons:
- Missing data—There is no central repository of data showing quality risks in applications and tests across all testing levels.
- High complexity—Complex software projects have thousands of tests, millions of lines of code in constant flux, and a large number of build artifacts. Calculating risk or holistic test coverage, even if the data was readily available, is a formidable task.
This is where Quality Intelligence technology comes in. It provides visibility for software development teams by:
- Monitoring tests and test frameworks, including unit, functional, UI, integration, end-to-end, and manual tests.
- Collecting data about which tests were run for each software version and their results.
- Tracking code changes, to identify major changes and whether they are tested.
- Tracking code usage in production, to identify which features are in active use and which are “dead code.”
- Correlating tests with code changes and production usage, to identify high priority features for testing.
- Visualizing the data to provide visibility into which tests are not really needed and represent wasted effort, and which parts of the software are at risk of quality issues.