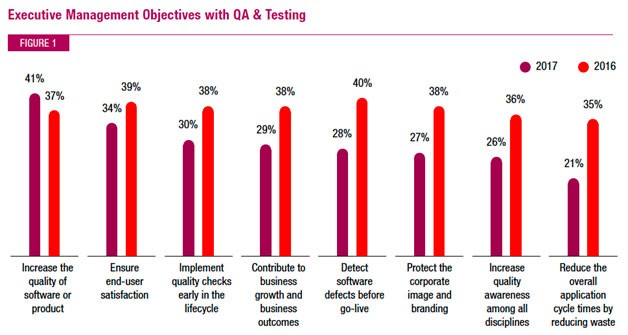
The World Quality Report 2017-18 states that the number one objective for QA & testing is the need to increase the quality of the product or software.
This statement is based on a survey taken by 1,660 senior technology professionals in 32 different countries. Here are the full results of the survey:
But how can you increase the quality of your product if you can’t assess it accurately? Which metrics should you use to begin with?
A good place to start is by learning which quality metrics and test metrics (which are two different things!) are available to you, and which you should strive to make available. Read more about this here.
The World Quality Report also tries to address this question by presenting three main areas where modern QA will have to focus in order to improve overall quality; one of these areas is Smart Analytics.
In this blog, I will highlight how Smart Analytics can really boost your game and increase the quality of your product.
Release Quality Analytics
The application owner/R&D manager who needs to make the release Go/No-Go decision knows that this decision might affect his brand reputation, and therefore his career. One would expect that he will examine all relevant quality indicators and make a highly data-driven decision. The reality in many organizations is that such decisions are based on a very narrow set of metrics or data sources (if at all) and that gut instinct plays a big role here.
SeaLights, by applying real-time analytics on all tests (whatever type) that were executed, examining each code change and its coverage level, and combining insights from production, provides the manager analytics that helps him determine his release readiness, and make data-driven decisions that will reduce the risk of a low-quality release.
Quality Trend Intelligence
Retrospectives are done in most software organizations. It can be once a year, per release, per sprint, or whenever.
However, during retrospectives, quality activities are rarely discussed.
Why is that? Isn’t the goal to review in the retrospective what went well, as well as what can be improved in the quality arena?
Part of the reason for that is the ineffective metrics that are available to determine the release/sprint’s quality and trends, and the lack of ability to easily identify and focus on the problematic areas in your quality process.
Ask yourself: can you really determine and quantify the effectiveness of your quality activity? What is the quality score of your application? If you can’t determine this and compare it over time, how can you know where you stand? How can you improve moving forward?
Sealights Quality Trend Intelligence, is a new feature that we just released to enable managers to conduct effective retrospectives based on quality development KPIs and scores, highlighting what went well and what can be improved.
Sealights Quality Trend Intelligence has two levels:
1.) An overview report, designed for managers who need a high-level view of what’s going on, quality wise. In each application, the report compares and provides a historical view of each application, focusing on three key aspects:
a.) Development Velocity: Measures if the team’s new code creation magnitude is higher, lower, or similar to the average of the past six months.
b.) Quality Score: Measures the application quality-maturity level with a score of 0-10. The score is based on coverage metrics, and test execution metrics, that are being analyzed on three spectrums: All the Application Code, only the Recently Modified Code, and only the Used in Production Code.
c.) Test Activity Score: Measures the quality activity progress and its effectiveness based on a score between 0-10. The same parameters used in the Quality Score are used here, but this time the delta between this period and the previous one is measured since this delta represents the progress (or the lack of it) that was just made.
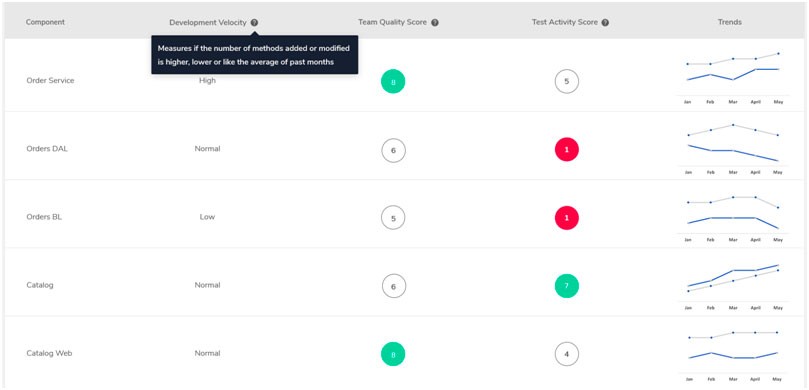
2. A drill-down report, designed with the team leader in mind. This application/component-centric report provides a wider picture of what happened during this period, highlighting the reasons behind their quality status score and activity effectiveness score, and helping them to focus on the things that require improvement or require celebrations.
So if your goal is to improve the quality of your product or your team’s effectiveness, contact us and we’ll be happy to demonstrate on your environment how to achieve this by using SeaLights Quality Intelligence Platform.