Build a Data-Driven Testing Strategy Using Quality Analytics.


Build a Data-Driven Testing Strategy Using Quality Analytics.
Intelligently Plan Your App Test Development.
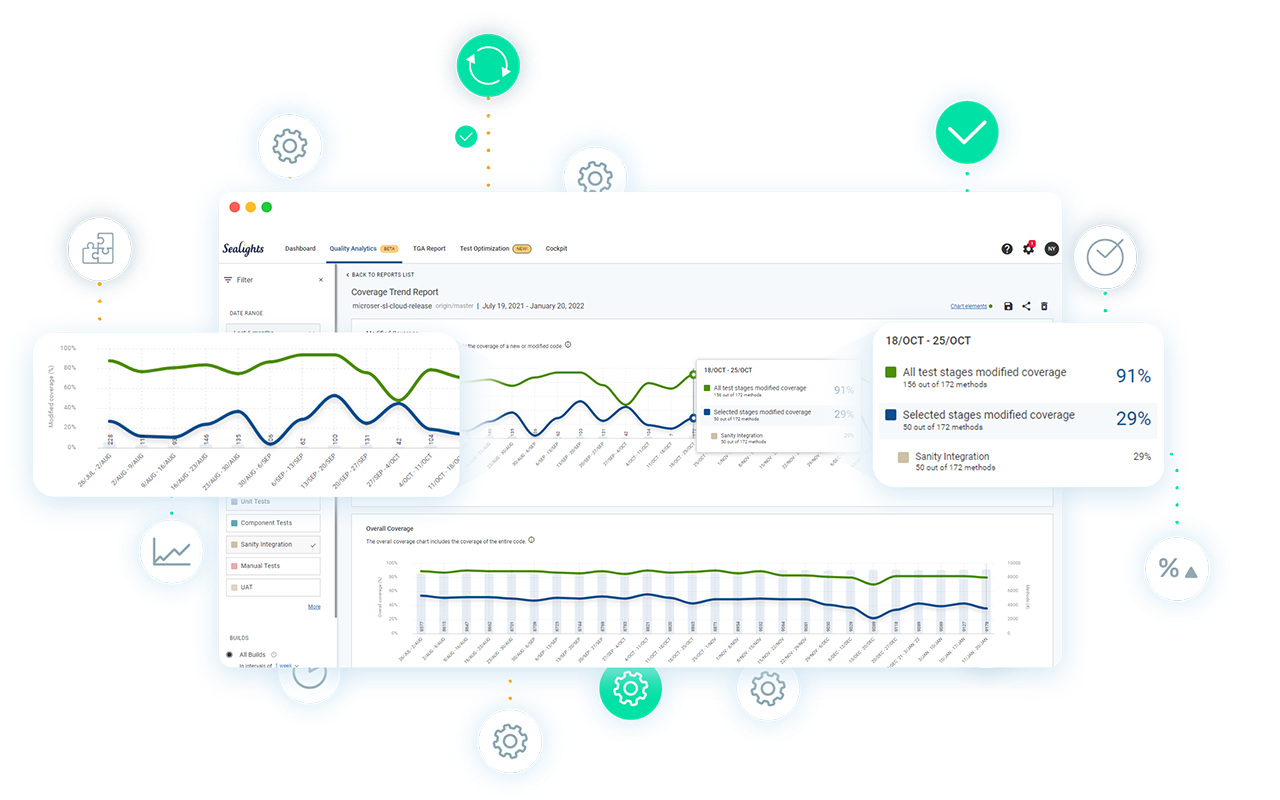
With the SeaLights’ Coverage Trend Report, managers get an overview of coverage trends of a specific application, throughout all test stages, over time. This report supports monolithic applications, as well as microservices. Managers can compare between modified coverage and overall coverage to ensure a consistent balance of both overall and modified coverage for each test type, across all test stages.


Visualize Your Overall Product Health.
The SeaLights’ Group Coverage Report enables managers to track the coverage trends of an entire product, team, line of business, or professional guild. Managers can view coverage trends of specific branches within several applications at once. They also have the ability to see both individual and aggregated coverage trends for modified as well as overall coverage.
Intelligently Plan Your App Test Development.

With the SeaLights’ Coverage Trend Report, managers get an overview of coverage trends of a specific application, throughout all test stages, over time. This report supports monolithic applications, as well as microservices. Managers can compare between modified coverage and overall coverage to ensure a consistent balance of both overall and modified coverage for each test type, across all test stages.
Visualize Your Overall Product Health.

The SeaLights’ Group Coverage Report enables managers to track the coverage trends of an entire product, team, line of business, or professional guild. Managers can view coverage trends of specific branches within several applications at once. They also have the ability to see both individual and aggregated coverage trends for modified as well as overall coverage.
How to Create a Data-Driven Testing Strategy using Quality Analytics ?
How a company defines and perceives quality has a huge impact on its testing strategy. A subjective definition of quality can be dangerous because there is no data to back it up and no way to monitor pre-defined quality standards or measure progress.
Quality analytics provide visibility on software quality over time, empowering companies to build a testing strategy based on accurate data. With these metrics, organizations can analyze what affects their quality the most, the impact of their different test stages, their quality trends, quality pain points, and more
- Market trends in software quality and testing
- Common testing strategy challenges and how to overcome them
- How to use SeaLights’ Software Quality Analytics to create a winning testing strategy that measures, improves, and monitors your organization’s quality
Identify Test Gaps for Every Type of Test.
End-to-End
Integration
Functional
System
API
Contract
Automated
Manual
Customized for Any Tool and Framework.


We Care About Your Data
Use a fully secured platform that protects your privacy.
We never access the source code, and your data stays encrypted, always.


